
File:Butterworth filter bode plot.svg

File originale (file in formato SVG, dimensioni nominali 1 250 × 875 pixel, dimensione del file: 31 KB)
| Questo file proviene da Wikimedia Commons. La pagina di descrizione associata è riportata qui sotto. |
Dettagli
| Descrizione |
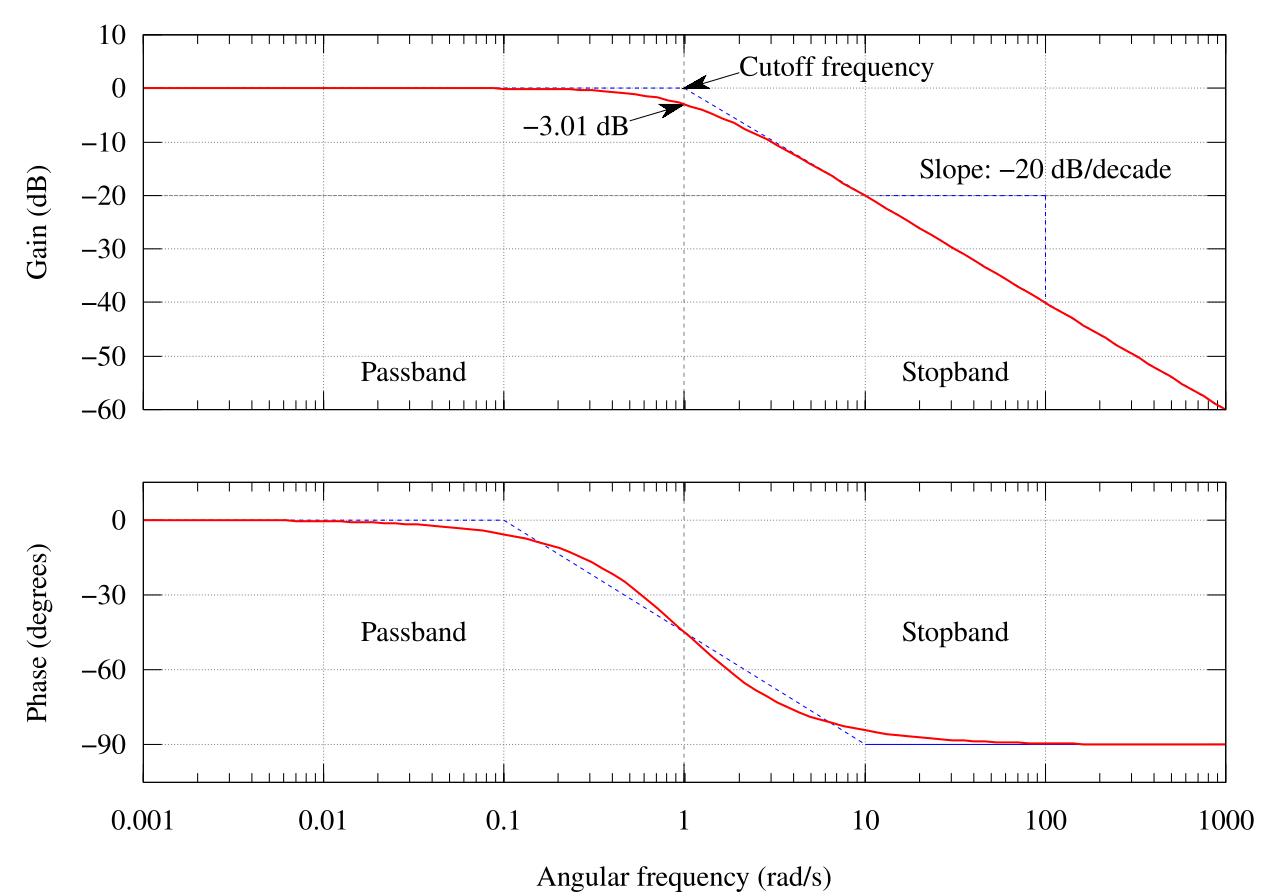
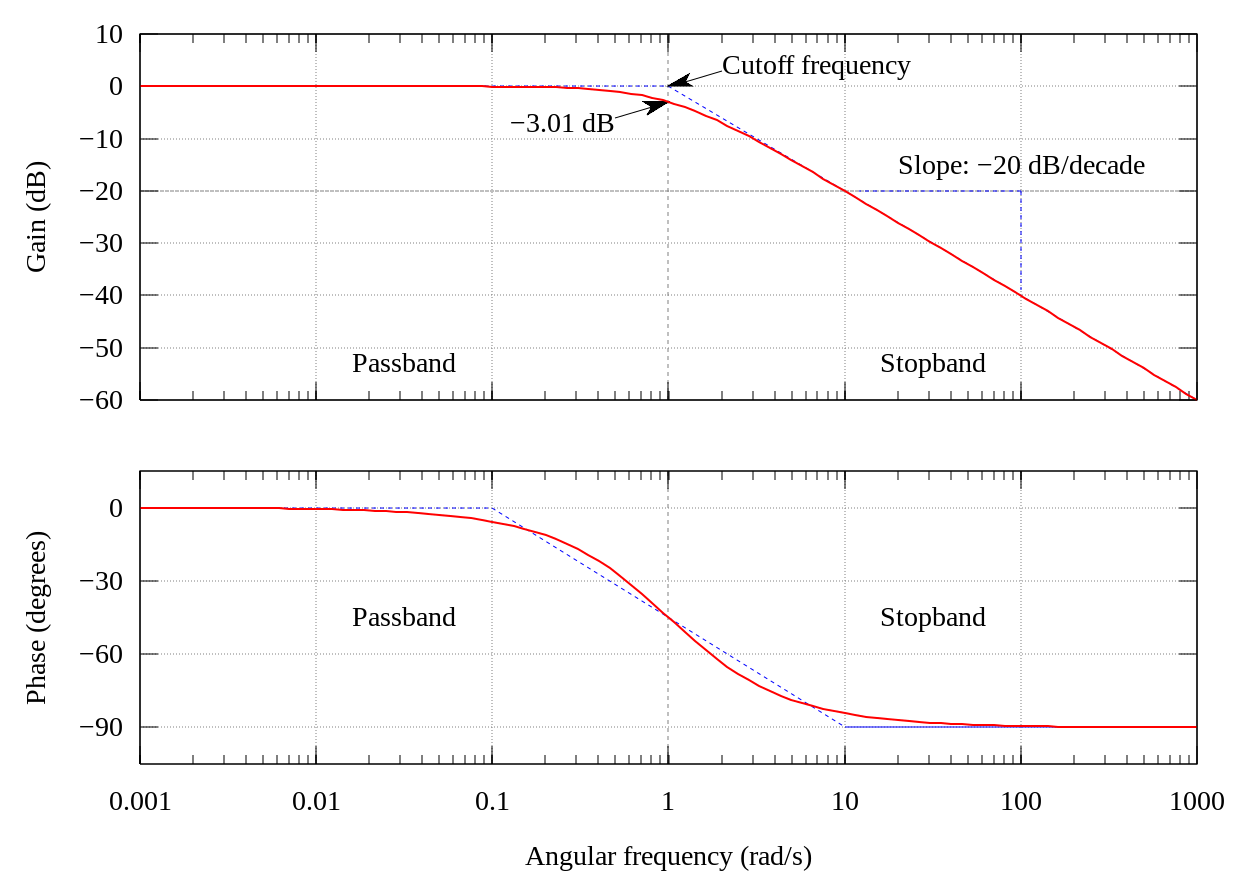
English: The Bode plot of a Butterworth filter with logarithmic axes and various labels. Cutoff frequency is normalized to 1 rad/s. Gain is normalized to 0 dB in the passband. Phase is in degrees because that's typical.
The code is kind of kludgy, but makes a good output. Generated in gnuplot with the script below (save as butterworth_bode_plot.plt and then open in gnuplot). Then it was postprocessed with Inkscape. See Wikipedia graph-making tips. Many orders on one plot: Image:Butterworth orders.png
Questa grafica vettoriale è stata creata con Gnuplot. |
||
| Data | 26 aprile 2006 (data di caricamento) | ||
| Fonte | Opera propria | ||
| Autore | Alejo2083 | ||
| Altre versioni |
[]
.png:
|
||
| gnuplot source | click to expand
set terminal svg enhanced size 1250 875 fname "Times" fsize 25
set output "Butterworth_filter_bode_plot.svg"

# Butterworth amplitude response and decibel calculation.  n is the order, which is just 1 in this image.
G(w,n) = 1 / (sqrt(1 + w**(2*n)))
dB(x) = 20 * log10(abs(x))
# Phase is for first order
P(w) = -atan(w)*180/pi


# Gridlines
set grid

# Set x axis to logarithmic scale
set logscale x 10

# No need for a key
set nokey #0.1,-25

# Frequency response's line plotting style
set style line 1 lt 1 lw 2

# Asymptote lines and slope lines are the same "arrow" style
set style line 3 lt 3 lw 1
set style arrow 3 nohead ls 3

# -3 dB arrow style
set style line 4 lt 4 lw 1
set style arrow 4 head filled size screen 0.02,15,45 ls 4

# Separator between passband and stopband line style
set style line 2 lt 2 lw 1
set style arrow 2 nohead ls 2


set multiplot

# Magnitude response
# =============================================
set size 1,0.5
set origin 0,0.5

# Set range of x and y axes
set xrange [0.001:1000]
set yrange [-60:10]

# Create x-axis tic marks once per decade (every multiple of 10)
set xtics 10
#set ytics 10

# No need for two sets of numbers
set format x ""

# Use 10 x-axis minor divisions per major division
set mxtics 10

# Axis labels
set ylabel "Gain (dB)"

# Draw asymptote lines
set arrow 1 from 1,0 to 1000,-60 as 3
set arrow 2 from .001,0 to 1,0 as 3

# -3 dB arrow
set arrow 4 from 2,3 to 1,0 as 4

# "Cutoff frequency" label uses same coordinates as the function
set label 3 "Cutoff frequency" at 2,4 l

# "-3 dB" label
set arrow 5 from 0.5,-6 to 1,-3 as 4
set label 4 "-3.01 dB" at 0.5,-7 r

# Draw a separator between passband and stopband and label them
set arrow 3 from 1,-60 to 1,10 as 2

# Label coordinates are relative to the graph window, not to the function, centered at the 1/4 and 3/4 width points
set label 1 "Passband" at graph 0.25, graph 0.1 c
set label 2 "Stopband" at graph 0.75, graph 0.1 c

# Draw slope lines and label
set arrow 6 from 100,-20 to 12,-20 as 3
set arrow 7 from 100,-20 to 100,-39 as 3
set label 5 "Slope: -20 dB/decade" at 100,-15 c

plot dB(G(x,1)) ls 1  title "1st-order response"


#Phase response
# =============================================
set size 1,0.5
set origin 0,0

# Set range of x and y axes
set yrange [-105:15]

# Create y-axis tic marks every 15 degrees
set ytics 30

# Regular numbers
set format x "% g"

# Axis labels
set ylabel "Phase (degrees)"
set xlabel "Angular frequency (rad/s)"

# Draw asymptote lines
set arrow 1 from 0.1,0 to 10,-90 as 3
set arrow 2 from 0.001,0 to 0.1,0 as 3
set arrow 10 from 10,-90 to 1000,-90 as 3

# -3 dB arrow
unset arrow 4 #from 2,3 to 1,0 as 4

# "Cutoff frequency" label uses same coordinates as the function
unset label 3 #"Cutoff frequency" at 2,4 l

# "-3 dB" label
unset arrow 5 #from 0.5,-6 to 1,-3 as 4
unset label 4 #"-3.01 dB" at 0.5,-7 r

# Draw a separator between passband and stopband and label them
set arrow 3 from 1,-105 to 1,15 as 2

# Label coordinates are relative to the graph window, not to the function, centered at the 1/4 and 3/4 width points
set label 1 "Passband" at graph 0.25, graph 0.5 c
set label 2 "Stopband" at graph 0.75, graph 0.5 c

# Draw slope lines and label
unset arrow 6 #from 100,-20 to 12,-20 as 3
unset arrow 7 #from 100,-20 to 100,-39 as 3
unset label 5 #"Slope: -20 dB/decade" at 100,-18 c

plot P(x) ls 1 title "Phase response"


unset multiplot
|


|
È disponibile una versione bitmap di questa immagine. Dovrebbe essere usata al posto di questa immagine vettoriale quando necessario. File:Butterworth filter bode plot.svg → File:Butterworth filter bode plot.png
Per ulteriori informazioni sulla grafica bitmap e vettoriale, leggi Commons:Transition to SVG. |
 |
Licenza

|
È permesso copiare, distribuire e/o modificare questo documento in base ai termini della GNU Free Documentation License, Versione 1.2 o successive pubblicata dalla Free Software Foundation; senza alcuna sezione non modificabile, senza testo di copertina e senza testo di quarta di copertina. Una copia della licenza è inclusa nella sezione intitolata Testo della GNU Free Documentation License. |
| Questo file è disponibile in base alla licenza Creative Commons Attribuzione-Condividi allo stesso modo 3.0 Unported | ||
| ||
| Questo tag di copyright è stato aggiunto nell'ambito dell'aggiornamento della licenza dei progetti Wikimedia. |
- Tu sei libero:
- di condividere – di copiare, distribuire e trasmettere quest'opera
- di modificare – di adattare l'opera
- Alle seguenti condizioni:
- attribuzione – Devi fornire i crediti appropriati, un collegamento alla licenza e indicare se sono state apportate modifiche. Puoi farlo in qualsiasi modo ragionevole, ma non in alcun modo che suggerisca che il licenziante approvi te o il tuo uso.
- condividi allo stesso modo – Se remixi, trasformi o sviluppi il materiale, devi distribuire i tuoi contributi in base alla stessa licenza o compatibile all'originale.
Cronologia del file
Fare clic su un gruppo data/ora per vedere il file come si presentava nel momento indicato.
| Data/Ora | Miniatura | Dimensioni | Utente | Commento | |
|---|---|---|---|---|---|
| attuale | 04:39, 12 ott 2023 | | 1 250 × 875 (31 KB) | Mikhail Ryazanov | +ru translation |
| 04:19, 12 ott 2023 |  | 1 250 × 875 (30 KB) | Mikhail Ryazanov | trying Glrx's advice | |
| 04:01, 12 ott 2023 |  | 1 250 × 875 (30 KB) | Glrx | try fixing two -30 labels // Editing SVG source code using c:User:Rillke/SVGedit.js | |
| 01:46, 12 ott 2023 |  | 1 250 × 875 (30 KB) | Mikhail Ryazanov | wrong rendering | |
| 01:45, 12 ott 2023 |  | 1 250 × 875 (30 KB) | Mikhail Ryazanov | hyphens → minuses | |
| 18:15, 27 set 2021 |  | 1 250 × 875 (30 KB) | R2d21024 | File uploaded using svgtranslate tool (https://svgtranslate.toolforge.org/). Added translation for es. | |
| 21:10, 26 apr 2006 |  | 1 250 × 875 (32 KB) | Alejo2083 | bigger fonts | |
| 20:55, 26 apr 2006 |  | 1 250 × 875 (32 KB) | Alejo2083 | ''This picture is the SVG version of Image:Butterworth_filter_bode_plot.png'' The Bode plot of a Butterworth filter with logarithmic axes and various labels. Cutoff frequency is normal |
Utilizzo del file
La seguente pagina usa questo file:
Utilizzo globale del file
Anche i seguenti wiki usano questo file:
- Usato nelle seguenti pagine di ar.wikipedia.org:
- Usato nelle seguenti pagine di cs.wikipedia.org:
- Usato nelle seguenti pagine di en.wikipedia.org:
- Usato nelle seguenti pagine di es.wikipedia.org:
- Usato nelle seguenti pagine di fr.wikipedia.org:
- Usato nelle seguenti pagine di fr.wikibooks.org:
- Usato nelle seguenti pagine di hu.wikipedia.org:
- Usato nelle seguenti pagine di it.wikipedia.org:
- Usato nelle seguenti pagine di ja.wikipedia.org:
- Usato nelle seguenti pagine di nl.wikipedia.org:
- Usato nelle seguenti pagine di pl.wikipedia.org:
- Usato nelle seguenti pagine di ru.wikipedia.org:
- Usato nelle seguenti pagine di tr.wikipedia.org:
- Usato nelle seguenti pagine di uk.wikipedia.org:
- Usato nelle seguenti pagine di zh.wikipedia.org: